
[updated] Some comments I received on the previous post made me realize there was a more fundamental flaw in drug company R&D productivity rankings that should be highlighted. Drug discovery is by and large a high failure rate multistep process with a long and relatively uncoupled feedback loop. (People with some knowledge of System Dynamics will immediately notice a similarity to Sloan’s Beer Game — a game not about drinking, but rather about the instability of supply chains with delayed feedback loops).
At every stage — target ID, target validation, hit finding, hit-to-lead, lead optimization, preclinical development, and the various phases of clinical development — anywhere between 50 and 90% of projects unexpectedly fail to progress (overall, 19 in 20 development projects fail). These are projects that well-informed and highly trained experts predicted would be worth pursuing, based on large amounts of available data. Yet they were wrong. Given that historic behavior in the system, it is unlikely that there are any currently available intermediate R&D metrics that predict overall R&D productivity (as measured by final economic profits) in a meaningful way. Numbers of patents, numbers of papers, numbers of projects, dollars spent per project, etc., etc. Any intermediate metric will not be predictive. Consider, for example, the following chart:
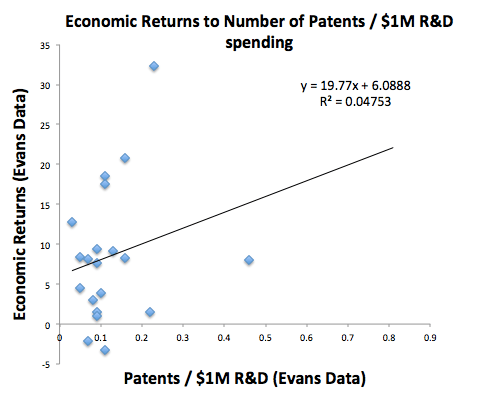
As a quick and dirty analysis, I’ve taken the Evans economic returns metric and replotted it as a function of the number of patents per $1M R&D spending for each drug company. Naively, one might expect that the more patents produced per $1M in R&D spending, the more productive a drug company would be. But that is not the case. The right side outlier is Allergan, with an 8% return and 0.46 patents per $1M. The top outlier is Celgene, with a 32% return and 0.23 patents per $1M. Including these outliers, there is essentially no correlation between the efficiency of generating patents and economic outcome. Most companies generate between 0.05 and 0.2 patents per $1M spent, with a wide range of economic return between -3 and 21%.
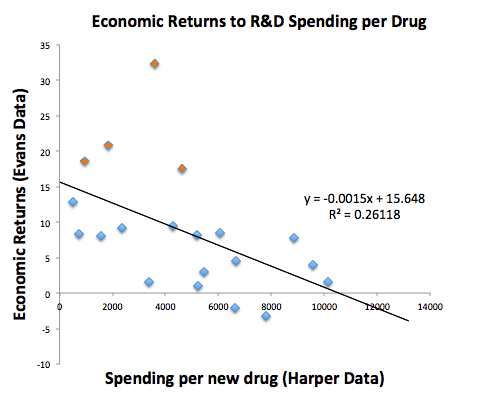
One can, of course, simply measure total R&D dollars spent or dollars per new drug and compare that to profit dollars out and catalog the historical economic productivity of each drug discovery company, or the industry as a whole. But even this metric is not predictive. Below I’ve merged some of Evans’ results with some data from an excellent analysis done by Matt Herper:
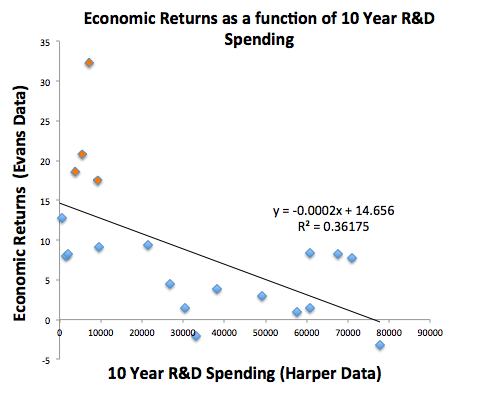
The top four data points in the upper left are Celgene, Gilead, Novo Nordisk and Shire. Even with those highly profitable biotechs* included in this data set, economic return does not correlate well (R squared = 0.36) with the total amount of R&D spending over the previous 10 years (the correlation is actually negative, and yes, Pfizer is the lower right outlier). Remove them, and there is no correlation at all. Plotting dollars per drug on the x-axis makes the correlation even worse. (dollar amounts are in $millions, FYI):
Correlation plots for the patent-derived quality of innovation, rank of therapeutic area and internal bias metrics don’t look any better.
As we’re all acutely aware, in the last 20 years overall economic productivity of the Pharma industry has been on a strong downward trend, and R&D spending at the company level is not tightly coupled to economic success. But, in addition, I’m pessimistic that there is meaningful predictive information on a more granular level. I’d be curious to hear your thoughts.
____
* One lesson from those firms is that it can be especially profitable to re-purpose existing drugs, and that you don’t need to spend much in R&D to acquire products. Of course someone else did have to pay for that R&D.
